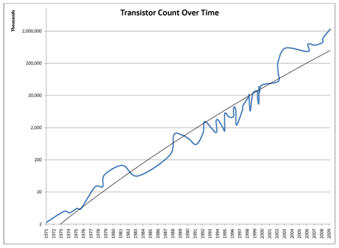
I recently had to generate a graph for Moore’s Law which plots CPU transistors over time, I thought the end result looked interesting so I wanted to share it:

The line is a bit more varied than most you see because I included AMD, Cyrix, and a few other CPU vendors. I also noticed that some of the data I was using included onboard cache in the transistor count and some didn’t. However, I think the graph is interesting because it does show how we’ve roughly doubled the transistors on processor every 18 months-2 years as Moore predicted. Of course, we’ve stopped increasing our speed and now we’re focused on driving more cores onto the chips – and therefore forcing developers to think about multi-threading their applications.

3 Comments
It looks GREAT! I would be happy to use it while presenting my research activities (giving you all the credits, obviously). Do you allow me? Could you provide me a higher-resolution image?
Thanks in advance
gx
I was surprised to find out that 90% of computers actually have the SpeedStep or Cool & Quiet enabled considering a tiny amount of the market is overclockers who turn it off.
I was surprised myself as well. It is amazing how much you can learn in just a minute or two.